Induced Earthquakes Throughout the United States
History of Induced Earthquakes
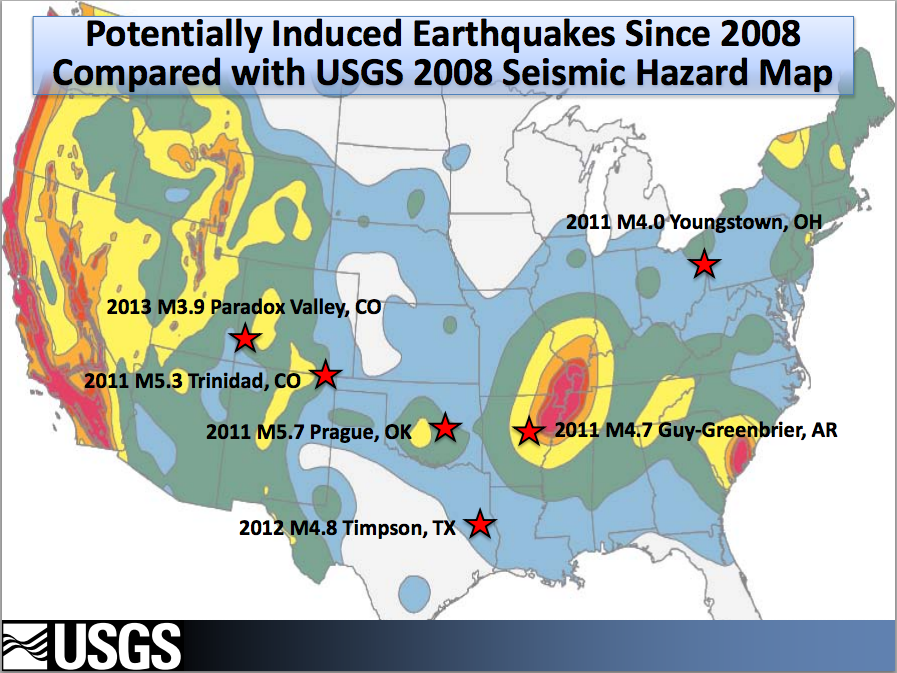
Fig. 1: Largest earthquakes in the United States thought to be induced. (Image courtesy the USGS.)
Induced seismicity -- earthquakes that are induced or triggered by human activity -- is on the rise all across America. The biggest seismic news is coming out of Oklahoma, but Ohio, Arkansas, Texas, Colorado, New Mexico and West Virginia have also experienced an increase in significantly sized earthquakes due to human activity.
There is a clear correlation between high-volume fluid injection and recent increases in earthquake activity in Oklahoma and other states. The process of fluid injection activates old basement faults that already exist. The introduction of such high volumes of fluid increases pressure in the pores of the rock deep underground, which in turn, can weaken faults and trigger earthquakes. It's important to note that the fluids do not create new faults: they simply activate old faults that already exist. Wastewater disposal wells associated with hydrofracking are the leading cause of induced earthquakes today, but waterflooding wells associated with enhanced oil recovery may also be part of the problem.
Keep up to date with the latest news about induced seismicity here.
But how can we be so certain that excess water is causing earthquakes?
Reservoirs and Earthquakes
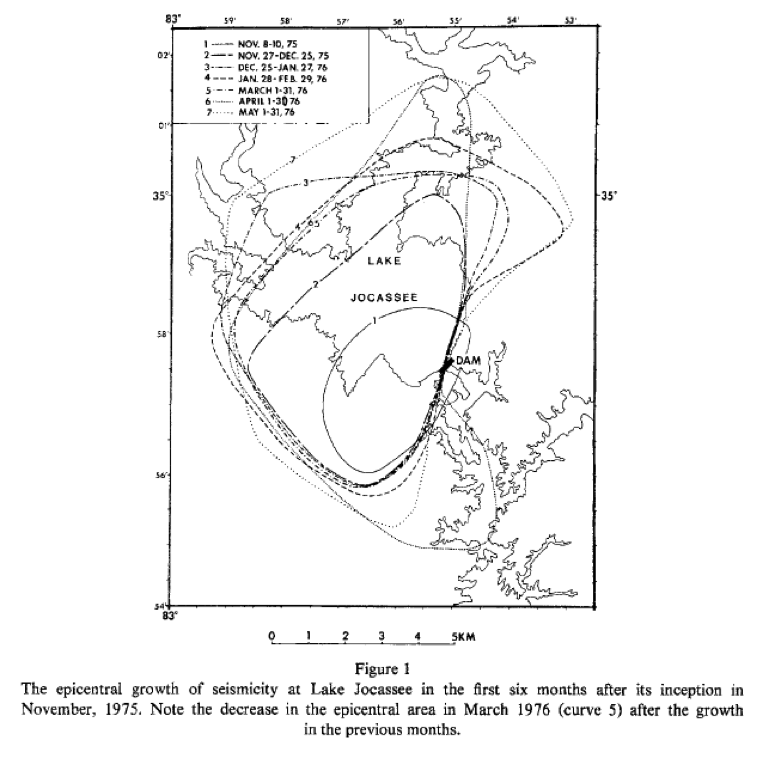
Fig. 2: Earthquakes associated with reservoirs migrate from the source (reference coming soon).
For nearly a century, seismologists have known about the connection between water and seismicity. As far back as the 1930s, seismologists were reporting increased earthquake activity after reservoirs were built. In 1967, a magnitude 6.3 earthquake struck near the Koyna Dam in India, killing 177 people and injuring over 2000, making it the largest and most devastating earthquake suspected to be induced by a reservoir. About a decade later, in South Carolina, researchers began a 10-year project to track earthquake activity after two new reservoirs were added to the state. The researchers found that as water levels increased at the reservoir, pore pressures increased at depth, and the pressure then migrated away from the reservoir, triggering nearby faults. Figure 2 shows that not only did earthquakes occur near the new reservoir, but they also migrated farther away with time.
The Rocky Mountain Arsenal Disposal Well
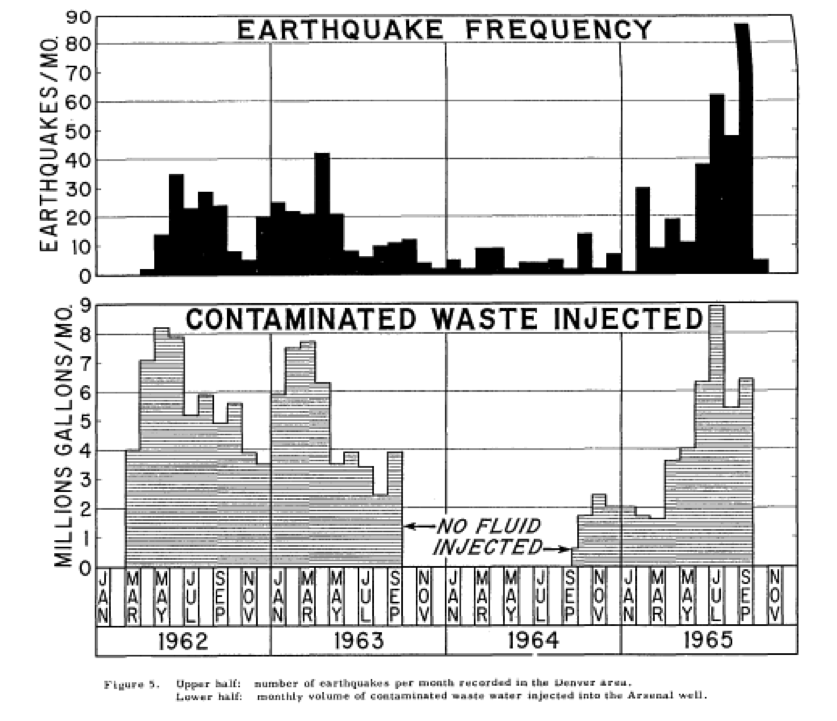
But reservoirs aren't the only cause of induced earthquakes. In the 1960s, the Rocky Mountain Arsenal near Denver began injecting wastewater into the ground to dispose of toxic chemicals. After an earthquake shook the area, researchers began tracking the volume of water injected into the ground and the resulting seismicity. As seen in figure 3, the correlation they found was strong, to say the least. This pivotal research confirmed that injecting wastewater into the ground can directly trigger ancient faults to slip and cause earthquakes. The seismologists also found that earthquakes in this particular study could occur as much as 5-7 miles away from the well. The distance to which the increased pressures can migrate and cause earthquakes in other areas is still uncertain. Another uncertainty is timing between when the water is injected and when the earthquakes begin. In figure 3, there appears to be about a month's lag time between when the water is injected and when earthquakes occur. Whether or not that lag time is consistent everywhere is unclear.
Induced Earthquakes in Oklahoma
Increase in OK Earthquakes
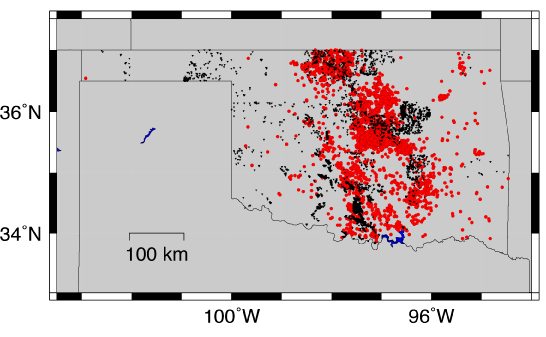
Fig. 4: Oklahoma earthquakes (red) and disposal wells (black)
Oklahoma, like so many states in the country, has historically had a few small earthquakes per year, with the occasional larger earthquake occurring every 50 to 100 years. Various faults crisscross the basement rock of the state, and even though they're not very active, they do sometimes slip, causing a small event. Or at least that was the case until 2010.
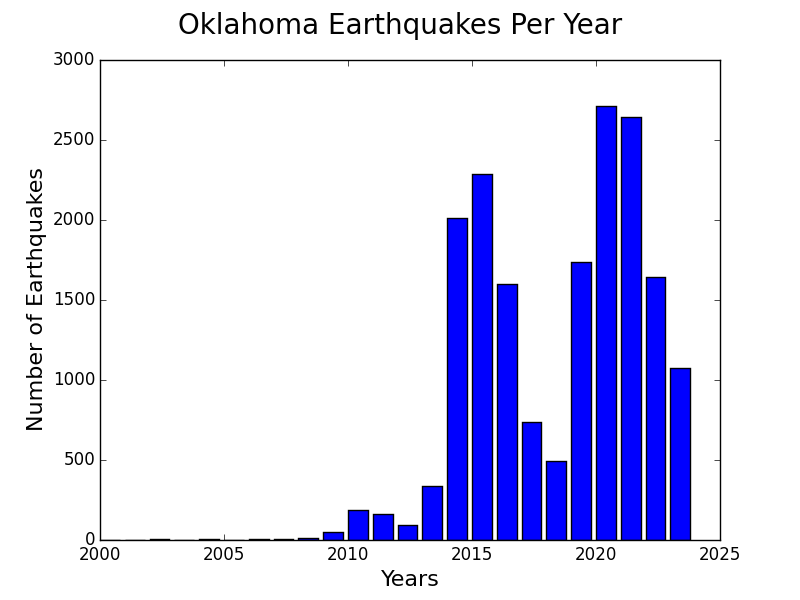
Fig. 5: The number of Oklahoma earthquakes increases dramatically after 2009 (graph is updated daily using ANSS data).
Figure 5 shows the number of intsrumentally detected and located earthquakes in Oklahoma. In 2010, the number of earthquakes dramatically increased, and they've been increasing ever since. The earlier events on the chart were mostly too small to be felt, but after 2010, the number of larger earthquakes also began increasing. Most are still smaller than magnitude 3, but there have been many earthquakes large enough to be felt in recent years, including the large M5.7 earthquake that shook Oklahoma City in 2011 (graph is updated daily using ANSS data).
Migrating Earthquakes
No one is debating that Oklahoma's seismicity is unusual, but the question of what's causing it has triggered a major debate. The magnitude 5.7 earthquake that occurred in November of 2011 near Oklahoma city was directly associated with a nearby disposal well by research performed by USGS and other researchers. However, many people still question whether or not all of the earthquakes in the region are induced or triggered. If all the events occurred right underneath disposal wells immediately after water was injected, the correlation would be easy to make. This is not what happens in Oklahoma though. Figure 4 shows earthquakes (red) and disposal wells (black), and many of the earthquakes are located farther away from disposal wells. That can cause confusion, but it doesn't mean the earthquakes aren't connected to the wells. As seen with the Denver Arsenal research and the reservoir research, water pressure can migrate away from its source and trigger earthquakes farther away, both in distance and time.
This video shows earthquakes occuring over time in Oklahoma, and as each event occurs, its time stamp appears above the video. The time period is from January of 2000 to May of 2014, but the first 10 years of earthquakes only represent the first 3 seconds of the video. It's still a work in progress, but it does show how the earthquakes cluster in a few locations and then migrate farther away. Also note the earthquakes that begin to occur in northern Oklahoma in late 2013 and 2014. (This should work in Chrome and Firefox, but it may not work in other browsers yet.)
Oklahoma More Active Than San Francisco
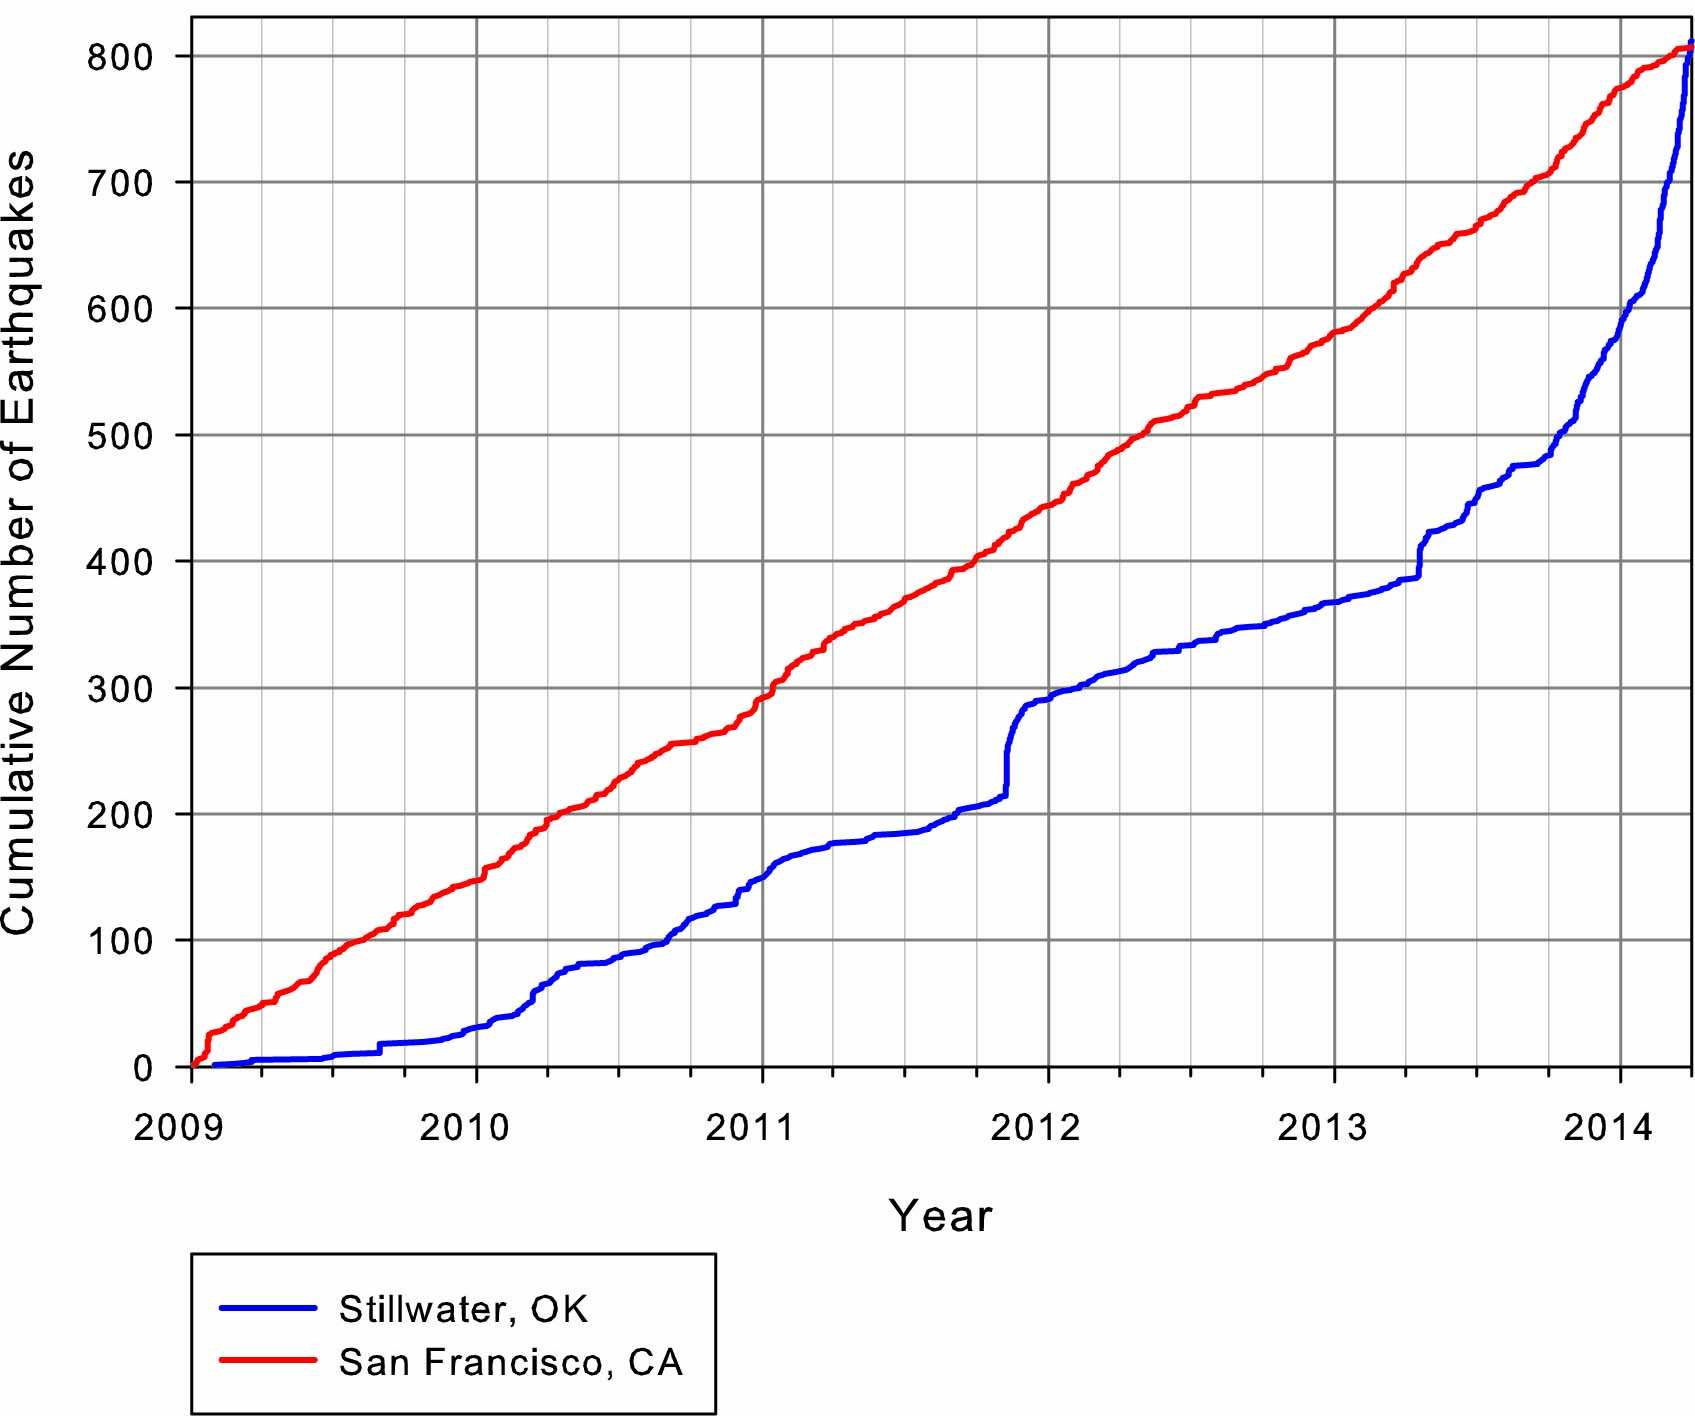
Fig. 6: In early 2014, Oklahoma became more seismically active than a similarly sized area surrounding San Francisco, CA
San Francisco, California is famous for its earthquakes. The city lies atop an active plate boundary with numerous large faults, including the San Andreas and Hayward faults. Oklahoma, on the other hand, is in the center of a continental plate where only very limited seismic activity is ever expected. So which is more seismically active right now?
Figure 6 shows two plots comparing seismic activity in an area encompassing a 170 km radius around Stillwater, Oklahoma (blue) to an area within a 170 km radius around San Francisco (red). Each line depicts the cumulative number of earthquakes for each area. If seismic activity is occuring naturally, then we expect to see a straight line with a constant slope, which is what we see for the San Francisco plot (red line). In Oklahoma, however, the increasing curvature of the plot (blue line) indicates that the rate of earthquakes is increasing rapidly. In fact, in early 2014, Oklahoma actually surpassed the San Francisco area with respect to the rate of earthquakes. Central Oklahoma, without having any major faults, is now more seismically active than San Francisco.
Water Pressure or Volume?
The big question to answer isn't whether or not wastewater disposal wells can trigger an earthquake, but rather, what's different about the wells that do trigger an event. There are quite a few factors to be considered with that question, including depth of the well and proximity to basement faults, but volume of injection and pressure of injection have also been considered. In Figures 7 and 8, we plotted the wastewater wells scaled to their maximum allowed injection volumes and pressures, and then we compared the two. Little correlation is seen between wells with high pressure and locations of earthquakes. However, a clear correlation can be seen in the proximity of earthquakes to wells that are allowed to inject high volumes of water into the ground.
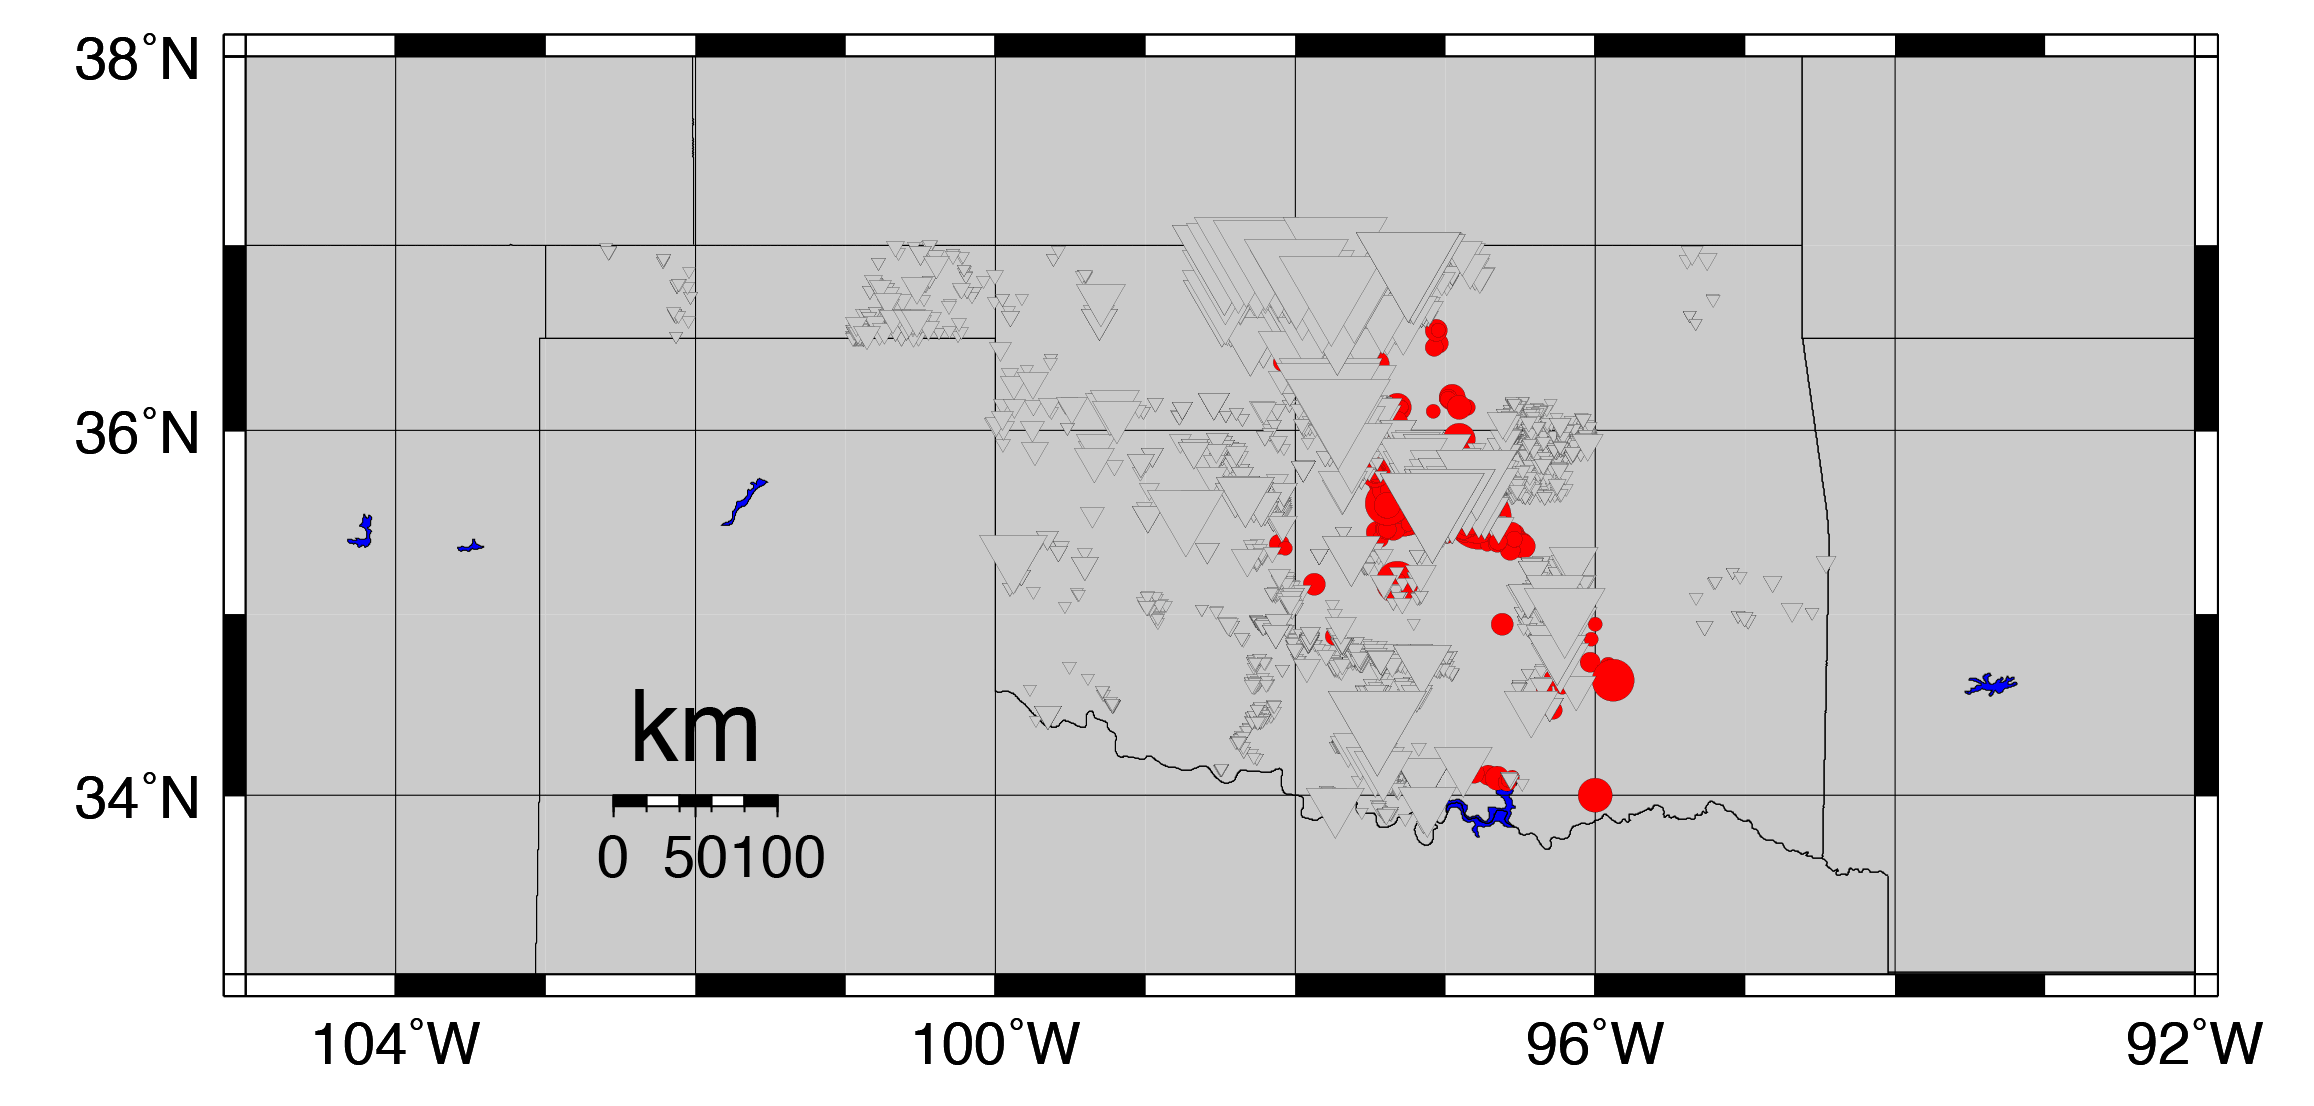
Fig. 7: Triangles show Oklahoma disposal wells scaled to maximum allowed volume of water injected, and red dots show earthquakes scaled to magnitude.
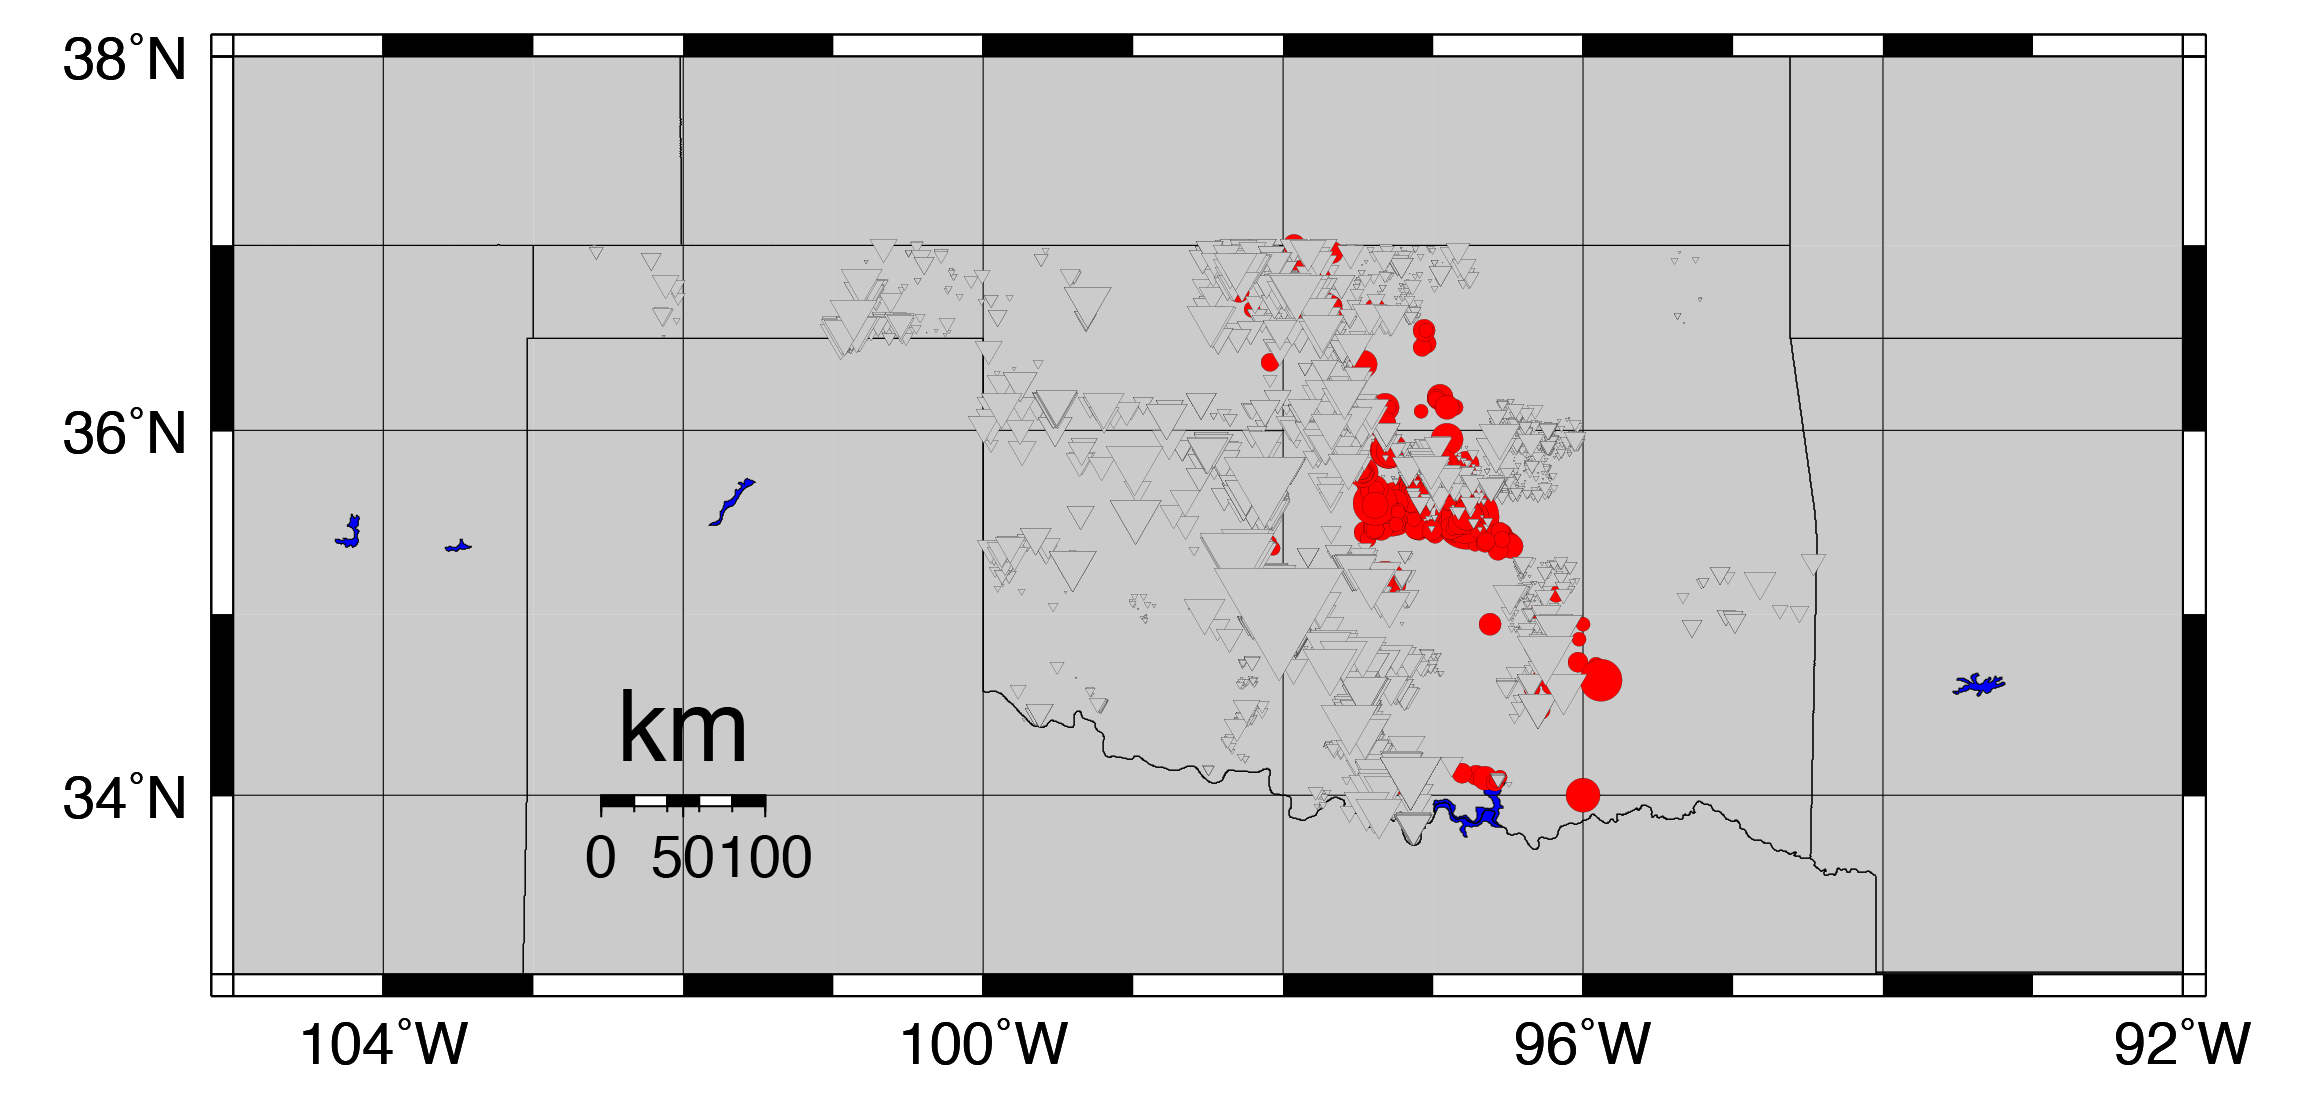
Fig. 8: Triangles show Oklahoma disposal wells scaled to maximum allowed pressure of injection, and red dots show earthquakes scaled to magnitude.
Focal Mechanisms
Beachball diagrams are a tool seismologists use to understand the faulting mechanism of an earthquake. The white and black colors of the balls in figure 9 indicate the direction of ground motion during the earthquake. In this figure, the beachballs depict movement for some of the larger earthquakes that occured in 2014. Notice that the beachballs look very similar: the northern and southern parts of the beachballs are black, while the eastern and western sections are white. This is an important observation because it indicates that the faults responsible for the earthquakes are consistently striking either northeast or northwest and have strike-slip motion. This implies also that there is a uniform regional stress responsible for all the earthquakes. The consistency seen here is quite unusual for natural earthquakes, which tend to show a larger degree of variability in a region of this size.
These data are available courtesy of Dr. Robert Herrmann at St. Louis University.
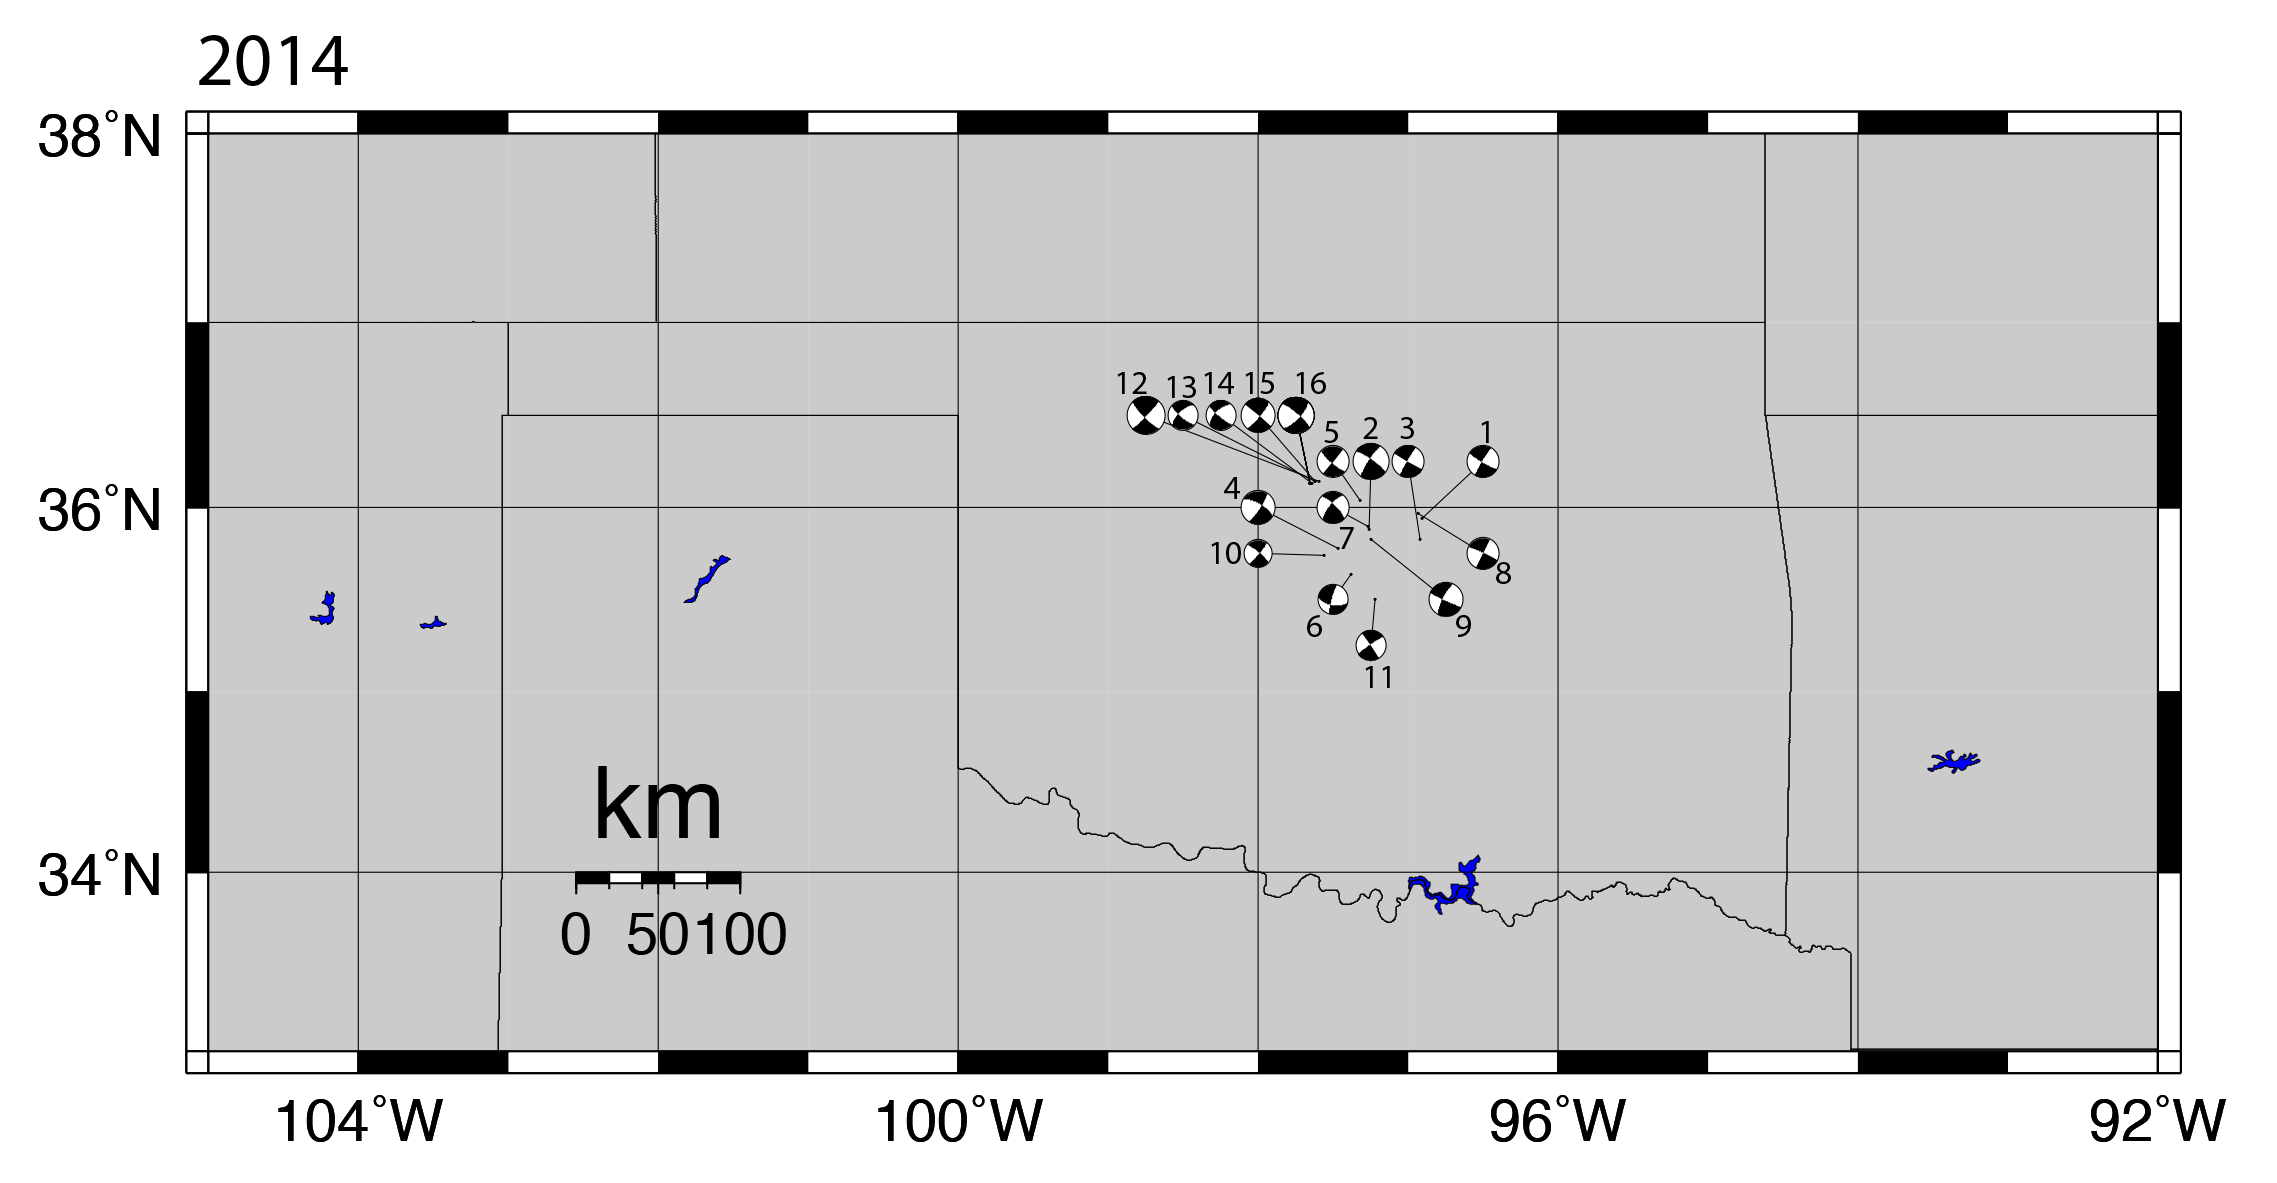
Fig. 9: Focal mechanisms for largest Oklahoma earthquakes in the first half of 2014
Induced Earthquakes in Ohio & West Virginia
Researchers at VTSO first developed an interest in induced seismicity after using the EarthScope transportable array (TA) of seismic stations to study wave propagation in the central United States. The TA is an array of 400 stations placed 70 km apart that started on the western side of the United States and has been leap-frogging across the country every two years. In 2010 and 2011, the TA was in the central US, where it collected data for many of the events in Oklahoma, Arkansas and Texas. The TA is providing a very unique opportunity to study seismicity in parts of the country that don't usually have enough seismic stations for very accurate research. With the TA now in the east, VTSO wanted to look at earthquakes in West Virginia and Ohio that seemed to be induced by wastewater disposal.
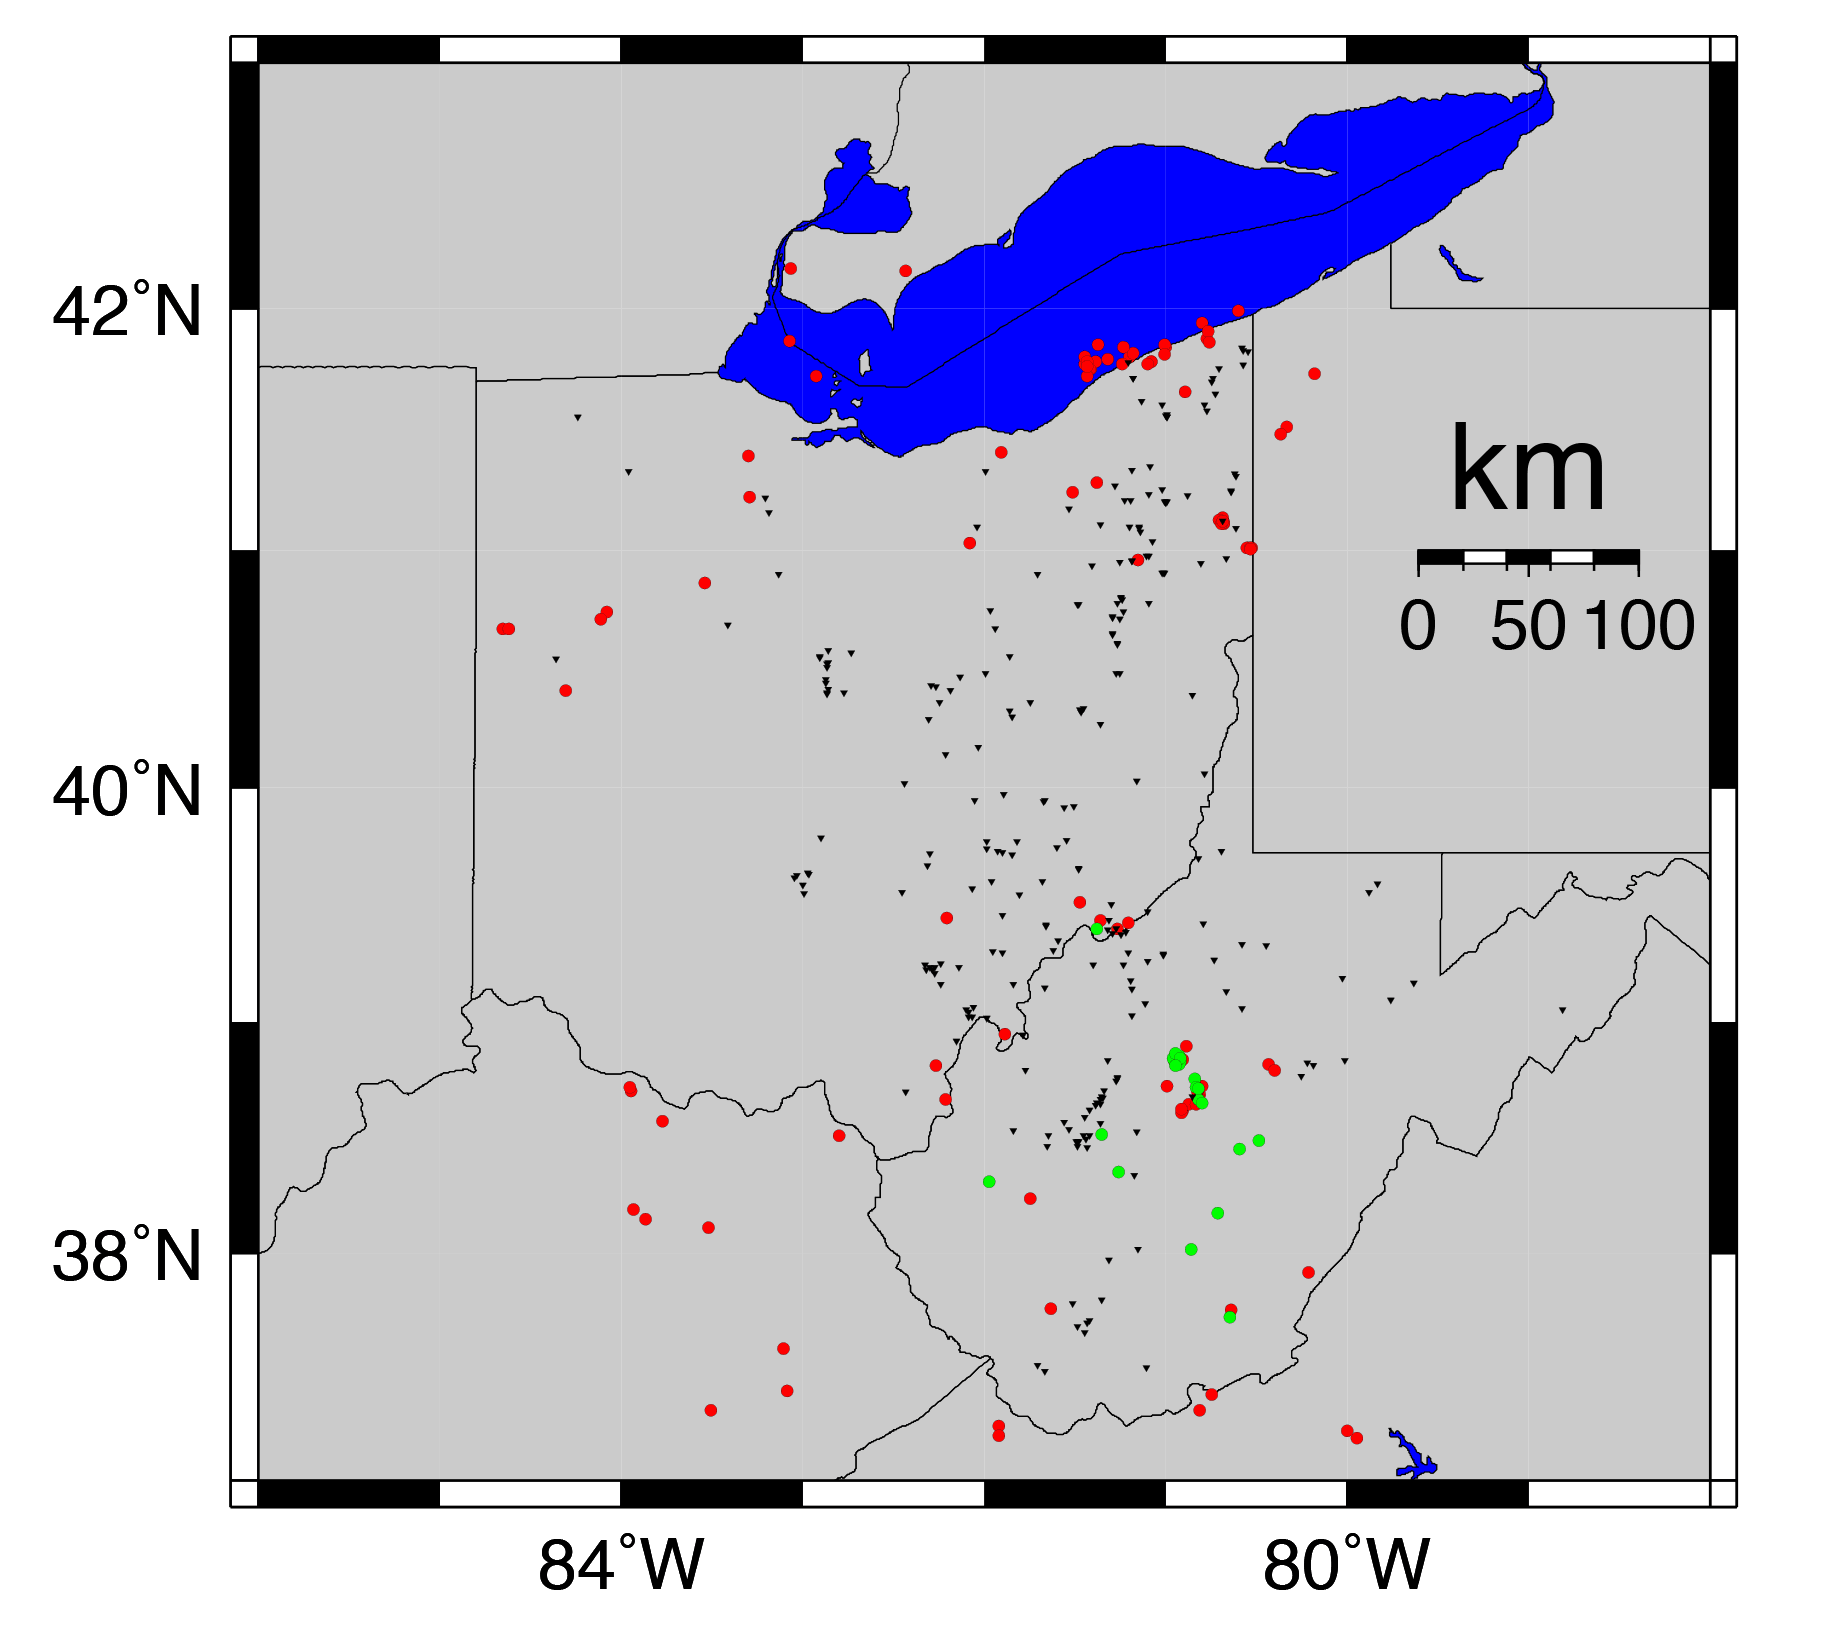
Fig. 10: Ohio and West Virginia earthquakes (red = USGS locations; green = VTSO locations) and disposal wells (black)
Using waveform cross correlations of seismic data from TA stations N53A, P53A and Q54A since the middle of 2013, we've identified nearly a hundred possible earthquakes in the two states. However, we've only been able to locate a handful of them. Although the TA provides better monitoring capabilities than previously available, it is still not adequate to locate events smaller than about a magnitude 2.5.
Figure 10 shows earthquakes located by VTSO (green dots), earthquakes located by the USGS (red dots), and wastewater disposal wells. Even with the limited seismic stations, our cross correlation program allowed us to locate significantly more events than would otherwise have been found. Earthquakes in Ohio, near Lake Erie, are assumed to be natural, as are events in western Ohio and Kentucky. However, the others in Ohio and West Virginia are candidates to have been induced.
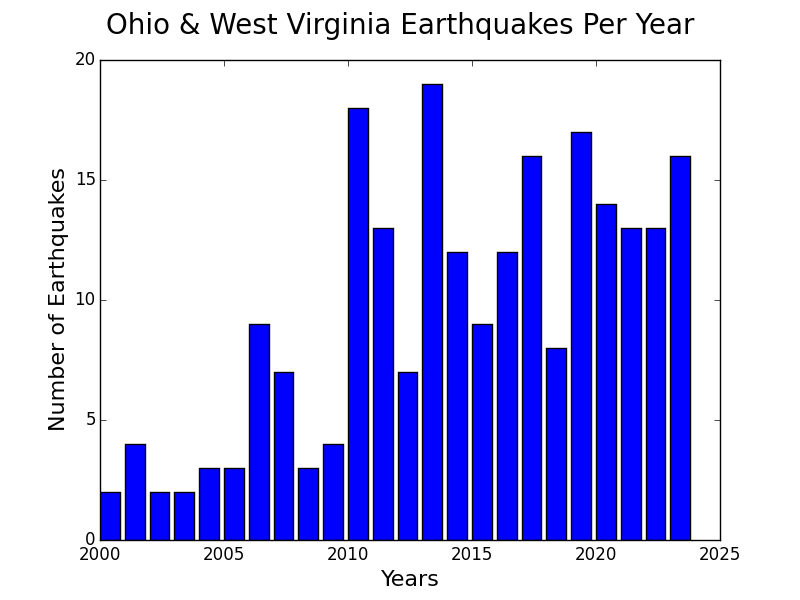
Fig. 11: Earthquakes in Ohio and West Virginia spiked in 2010, decreased in 2012 and spiked again in 2013 and 2014 (graph is updated daily using ANSS data)
If a single earthquake is located with no wells nearby, we assume it's natural. If earthquakes occur in clusters and there's a wastewater disposal well nearby, we start to think they could be induced. However, there's one exception seen on Figure 10 in central West Virginia, in which a cluster of earthquakes occurs and there isn't a disposal well. This appears to be one of the few cases of a hydrofracking operation triggering earthquakes. Over the course of three weeks, West Virginia experienced two magnitude 2.5 earthquakes and one magnitude 3.0 earthquake. These earthquakes were felt locally and reported by residents. Our understanding of this situation is that an exploratory hydrofracking operation was initiated, and it stopped soon after the earthquakes began. We detected no further earthquake activity at that location. This instance of an association of hydrofracking with earthquakes large enough to be felt is unusual: most induced earthquakes that are large enough for people to feel are triggered by wastewater disposal wells.
Figure 11 shows seismic activity peaking in 2010, 2011 and 2013. More earthquakes occurred in Ohio in 2014 that have not been plotted yet. An update will be coming soon.
Induced Earthquakes in Other States
Induced seismicity is a problem plaguing a handful of states across America. VTSO has spent time researching Oklahoma, Ohio and West Virginia, but other states are also experiencing an increase in earthquake activity. Though we haven't extensively studied them all, we've at least been tracking each state with suspected induced activity.
Arkansas Earthquakes
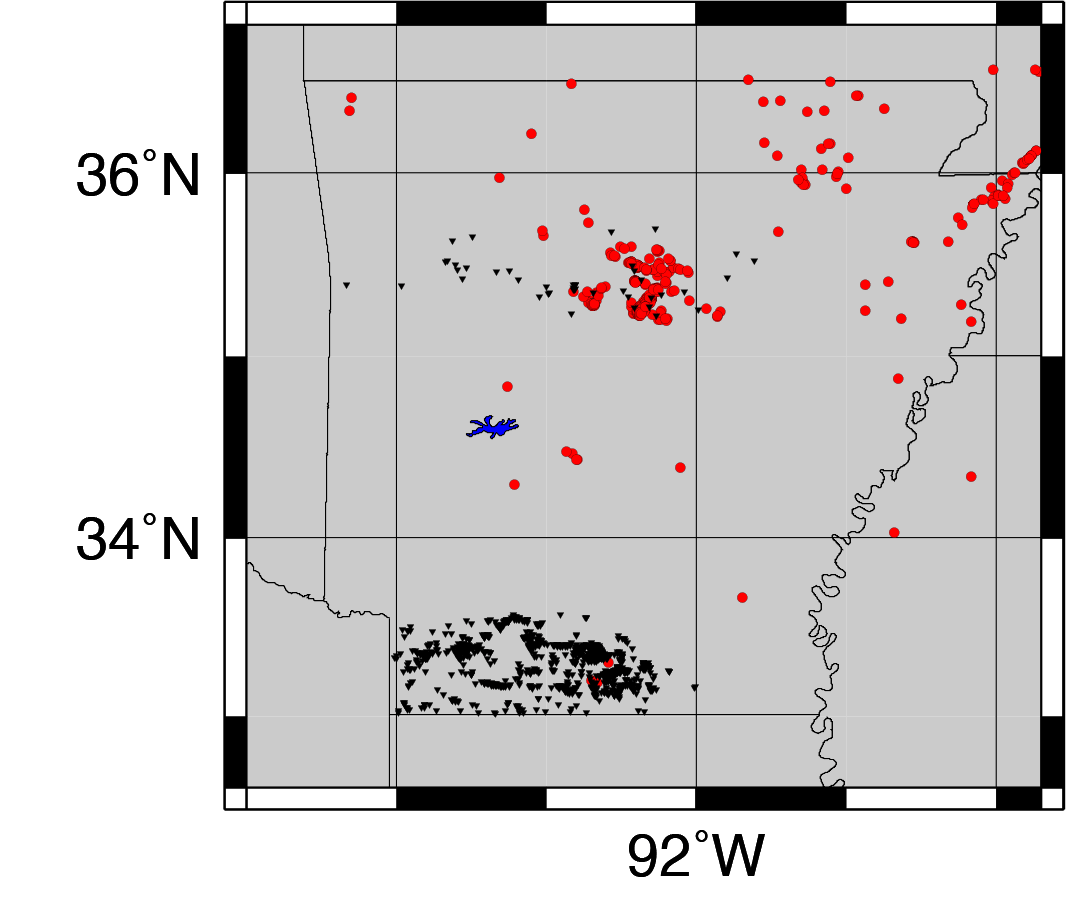
Fig. 12: Arkansas earthquakes (red) and wastewater disposal wells (black).
Arkansas experienced an increase in seismic activity in 2010 and 2011, culminating with a M4.7 earthquake in the spring of 2011. Dr. Stephen Horton at the University of Memphis researched the events, and concluded that there was a strong likelihood that these were induced earthquakes. Earthquakes aren't uncommon in the northeastern section of the state, which is part of the New Madrid Seismic Zone, but earthquakes in the central section of the state were definitely unexpected. The Arkansas county in which this event occurred put a moratorium on wastewater disposal soon after that earthquake, and with the moratorium came an end to the earthquakes. Until...
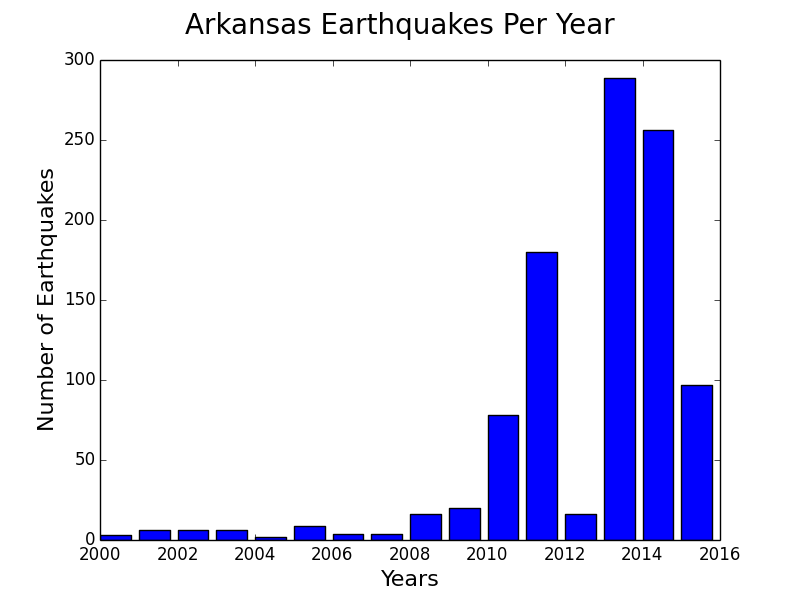
Fig. 13: Earthquakes in Arkansas spiked in 2011 and then again in 2013 (graph is updated daily using ANSS data)
In 2013, earthquakes began occurring again in Arkansas. More research is needed to determine if these are connected to disposal wells in other counties or if these earthquakes have some other cause.
Kansas Earthquakes
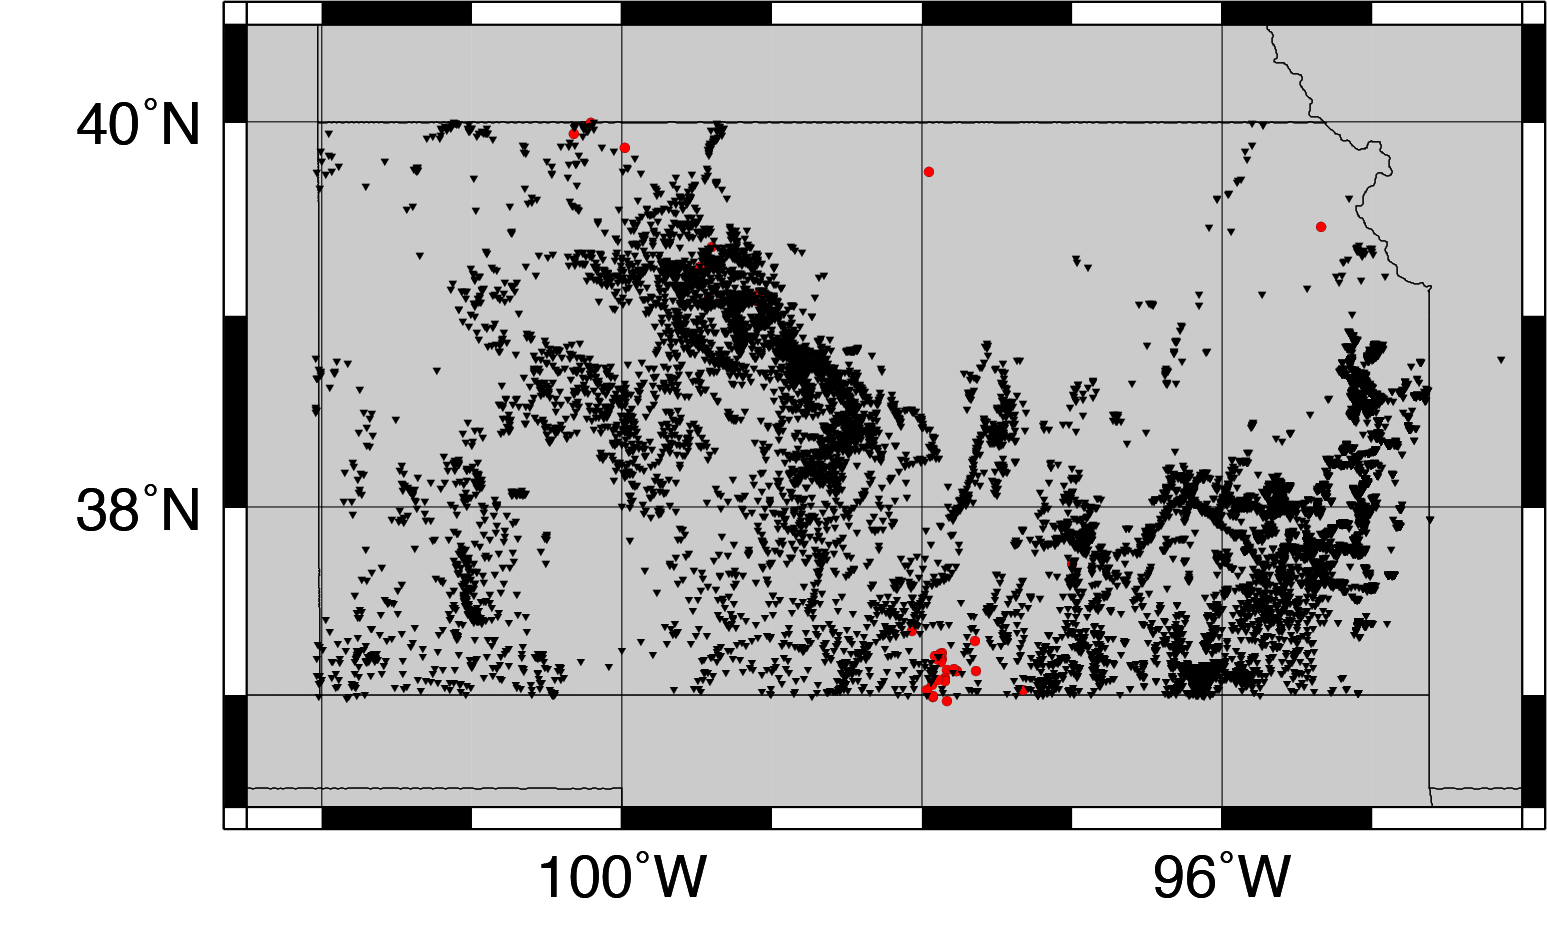
Fig. 14: Kansas earthquakes (red) and wastewater disposal wells (black). Click here for an interactive map of Kansas earthquakes and wells.
Kansas had plenty of wastewater disposal wells (over 15,000), but they had an extremely small record of earthquakes. Until...
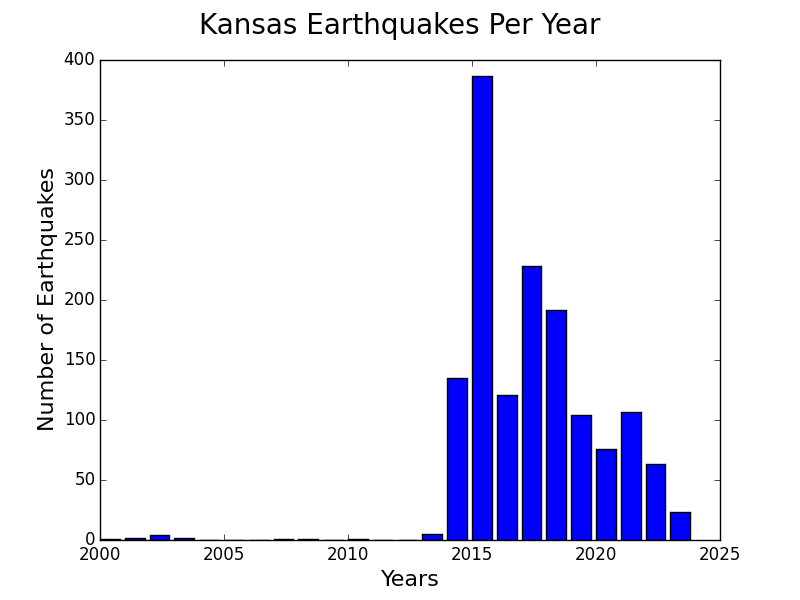
Fig. 15: Earthquakes in Kansas have been increasing in number and magnitude since late 2013 (graph is updated daily using ANSS data)
Toward the end of 2013, the number of earthquakes in Kansas began increasing rapidly, just north of the Oklahoma border. If we really want to understand what's happening in Oklahoma, Kansas may be the best place to look. It's possible these events are triggered by enhanced oil recovery, but it will take more research to know if that's the case or not. The most important data we lack involves the volumes of water being injected into the ground, but those data are not currently available.
Colorado Earthquakes
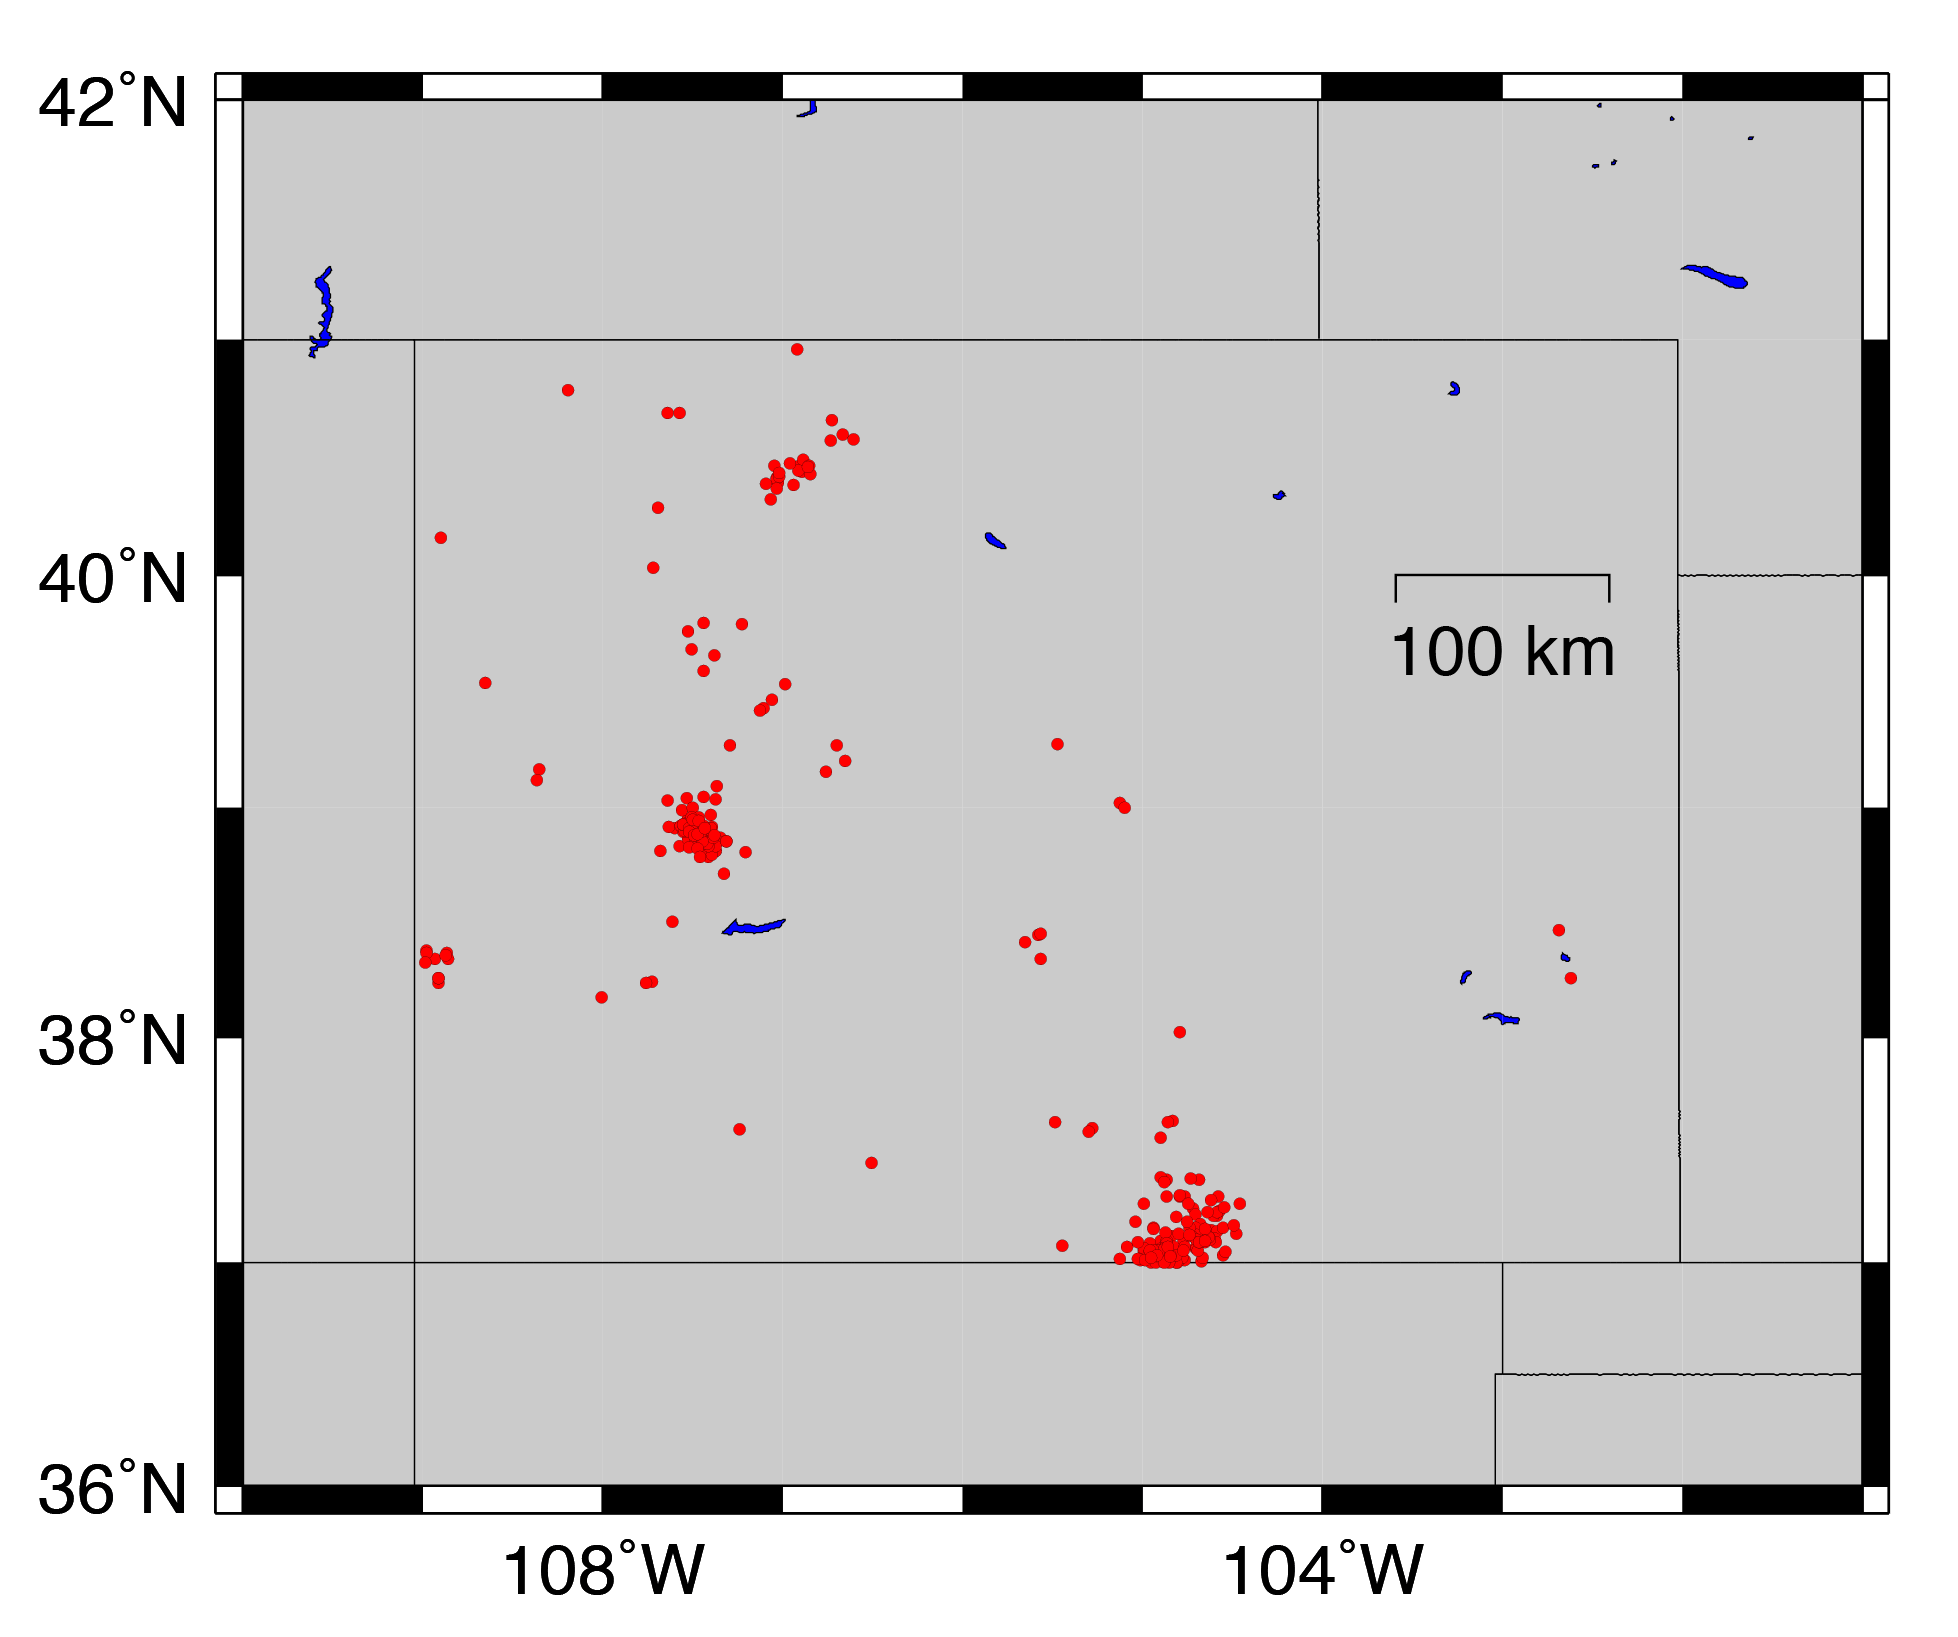
Fig. 16: Colorado earthquakes (red) and wastewater disposal wells (black).
Colorado has a long history of induced earthquakes, going back to the first study in the 1960s at the Rocky Mountain Arsenal. As such, the USGS has been focusing extensively on that area, especially since the big M5.3 Raton Basin earthquake in 2011. (A new plot with wastewater disposal wells will be added soon.)
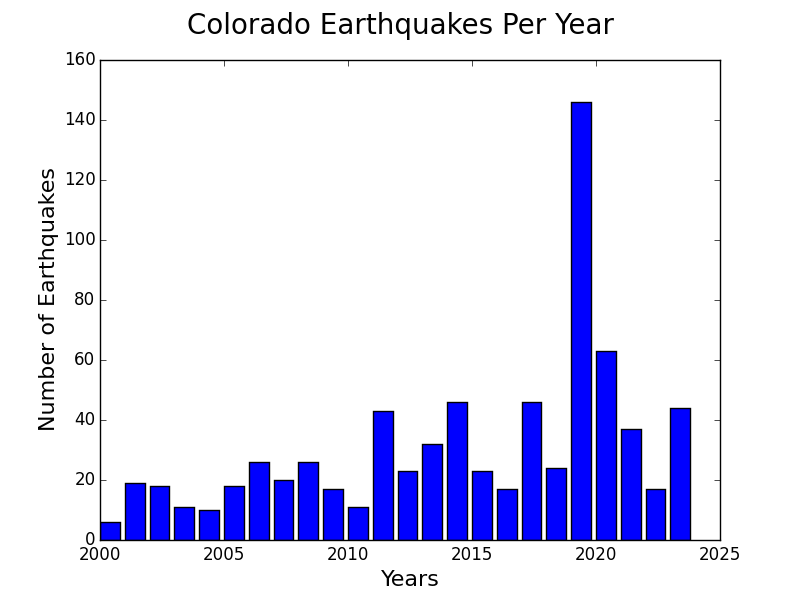
Fig. 17: Earthquakes in Colorado (graph is updated daily using ANSS data)
After the big earthquake of 2011, earthquake rates in Colorado have decreased.
New Mexico Earthquakes
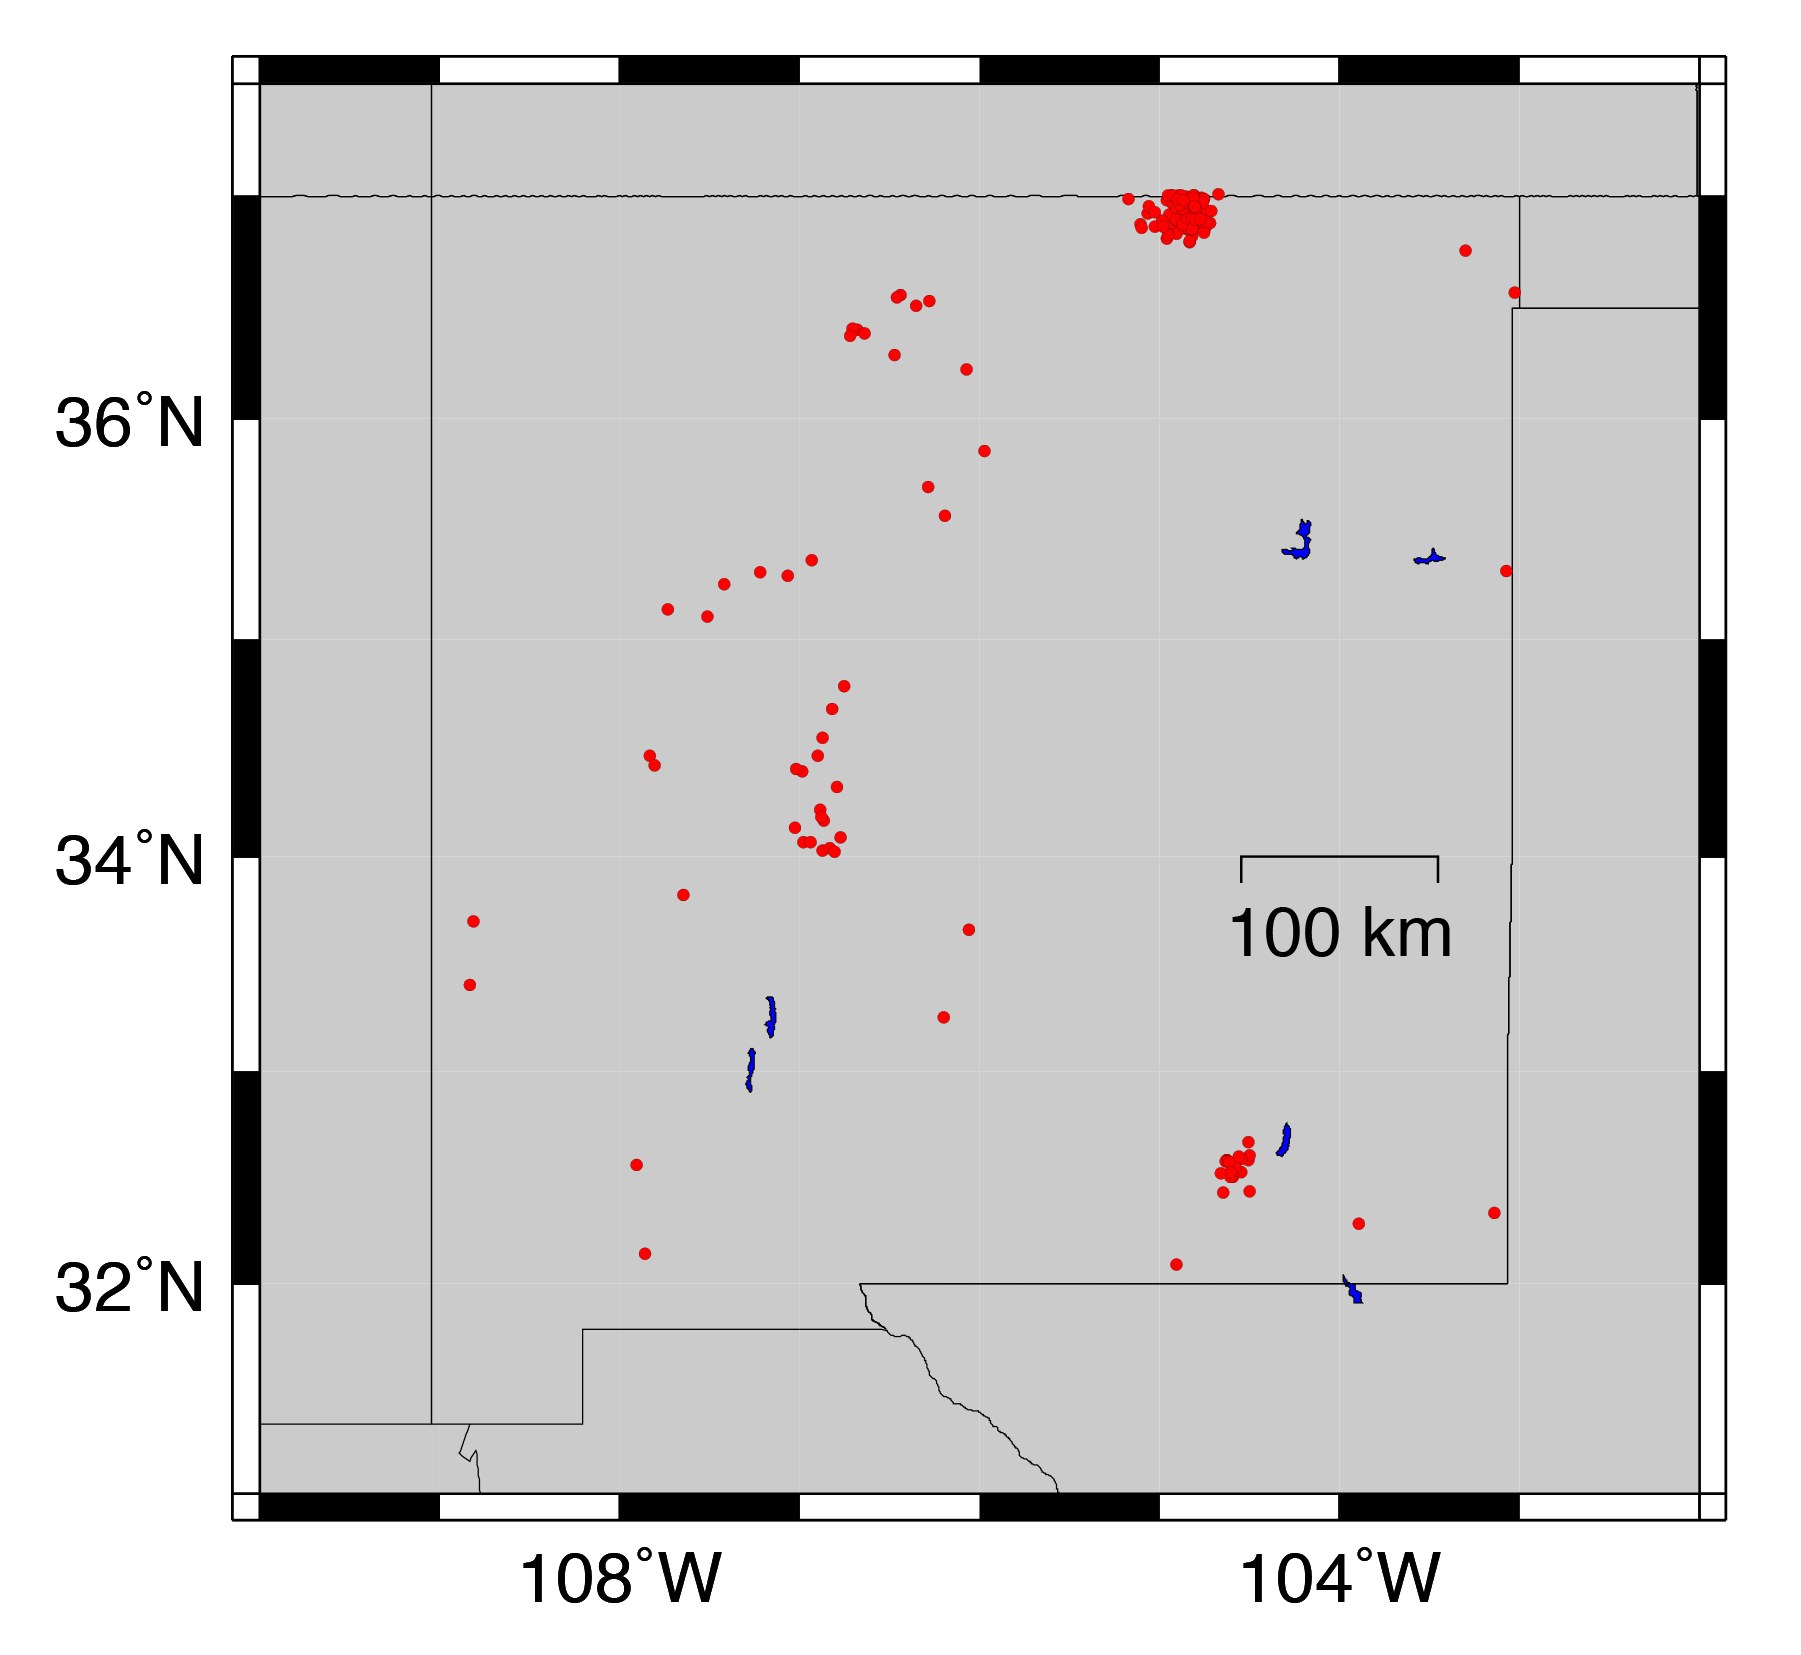
Fig. 18: New Mexico earthquakes (red) and wastewater disposal wells (black).
New Mexico is another region in which the USGS has focused attention due to the increased likelihood of induced earthquakes. (We don't have disposal well locations for New Mexico yet.)
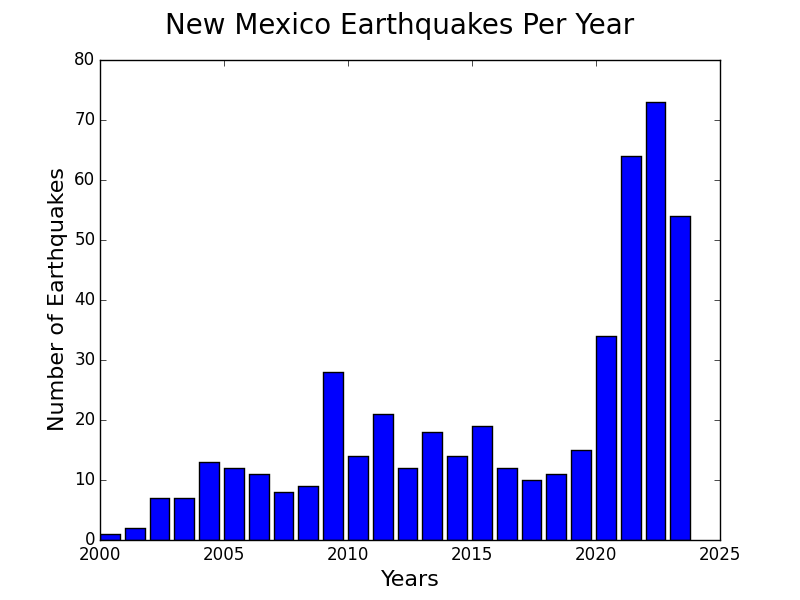
Fig. 19: Earthquakes in New Mexico (graph is updated daily using ANSS data)
Texas Earthquakes
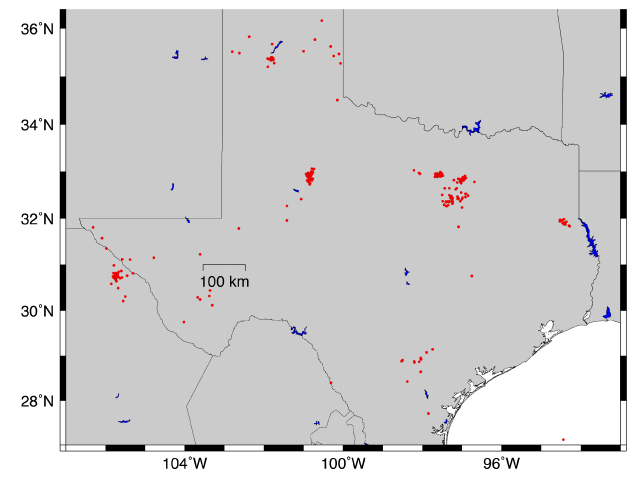
Fig. 20: Texas earthquakes (red) and wastewater disposal wells (black).
Texas earthquakes have been studied extensively by Dr. Cliff Frohlich at the University of Texas (examples of research here and here), among others. VTSO is also working with a group at the National Energy Technology Laboratory that has been looking into earthquakes in Johnson County, Texas, near one of the central cluster of events. (We are unable to access disposal well locations in TX yet due to their high costs.)
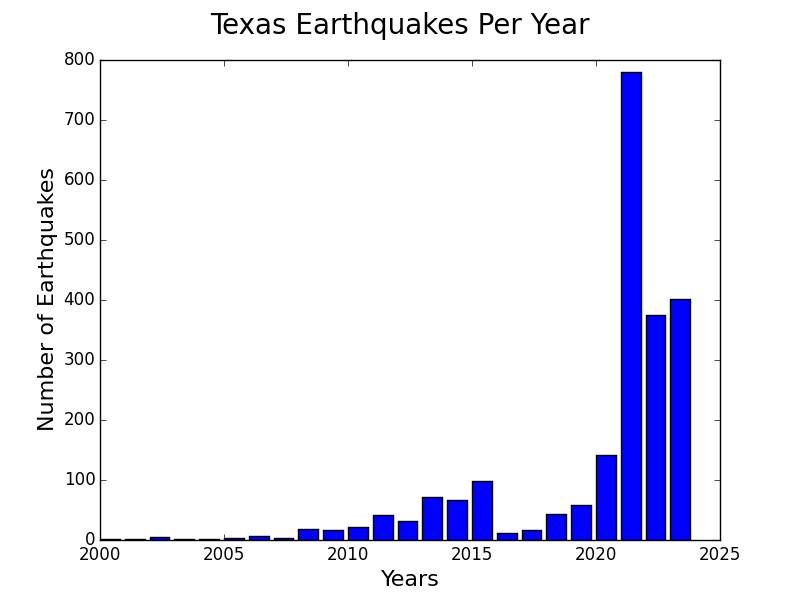
Fig. 21: Earthquakes in Texas spiked in 2011 and then again in 2013 (graph is updated daily using ANSS data)
In 2013, seismic activity was recorded near the Dallas/Fort Worth area, however, that activity slowed as 2014 got under way.